


Bitcoin is trading near $80,148 with just nine days left until the November 3 U.S. midterm elections. Historical charts show that Bitcoin suffered sharp drops around past midterm cycles before rising to much higher levels in the following years.
With Bitcoin already down 4.1% this month, could history point to another major rally after the election.
Bitcoin Bottom After Midterm Election
Crypto analyst Ash Crypto has shared a chart showing how Bitcoin performed around past U.S. midterm elections. In the previous four cycles, Bitcoin saw sharp price drops before recovering in the following years.
The chart shows Bitcoin fell 71% in 2010, 64% in 2014, 51% in 2018 and 27% in 2022.


Ash Crypto also points out that Bitcoin often reached its lowest price shortly after midterm election day. In the past four cycles, the bottom came 33 days after the 2010 election, 71 days after the 2014 election, 39 days after the 2018 election, and 13 days after the 2022 election.
However, this year’s pattern is different.
Bitcoin fell to around $57,718 on July 1, about 125 days before the November 3 midterm elections. This means Bitcoin reached its low well before the election, unlike in the previous four cycles.
Historical Midterm Chart Shows Major Price Gains
Looking at the Bitcoin monthly chart to compare Bitcoin’s price gains around previous U.S. midterm elections with the highs it reached before the next midterm cycle.
In the 2010 cycle, Bitcoin started at around $0.13 and later climbed to $1,242.36. This means its price rose more than 9,500 times during that period.
Later in the 2014 cycle, Bitcoin rose from roughly $415.36 to $19,600.53, gaining about 4,620%. This shows how far Bitcoin’s price climbed from its earlier level.

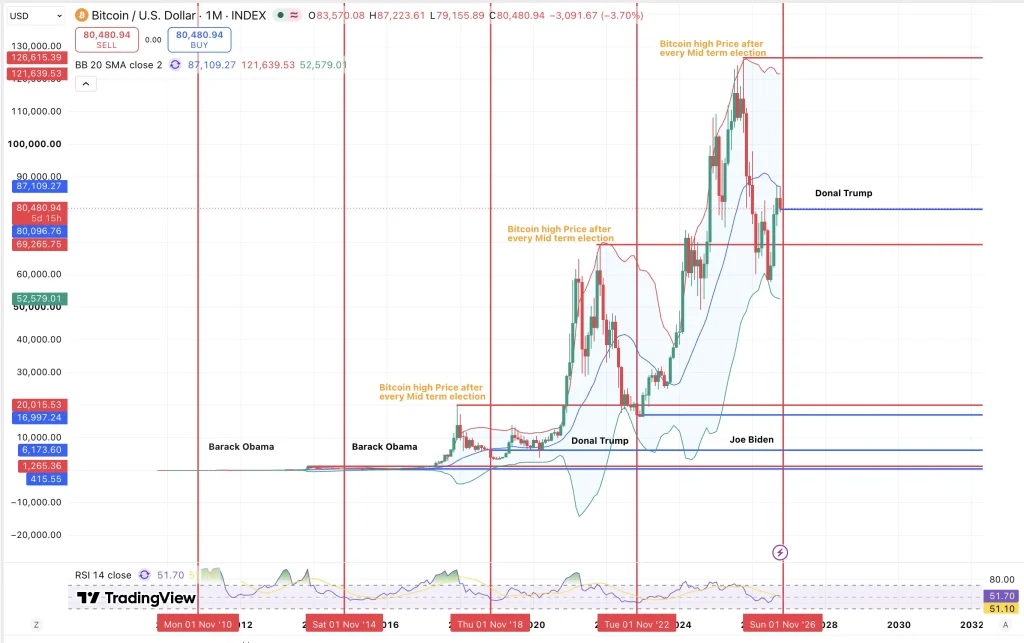
During the 2018 cycle, Bitcoin moved from $6,173.60 to a high of $69,265.75, an increase of nearly 1,022%.
In the 2022 cycle, Bitcoin started at around $16,997.24 before reaching a high of $126,615.39. This marked a rise of approximately 645%.
Overall, the chart shows that Bitcoin reached much higher prices in the years following each midterm cycle.
Can Bitcoin Repeat Its Historical Rally?
Bitcoin is trading around $80,145 on the monthly chart, approximately 38.8% above its July low of $57,718. However, Bitcoin is down about 4.1% since the beginning of this bullish October month.
Based on past cycles, Bitcoin could reach $120,000 next soon after the U.S midterm election.
Was this writing helpful?
Story Ends Here
Trust with CoinPedia:
CoinPedia has been delivering accurate and timely cryptocurrency and blockchain updates since 2017. All content is created by our expert panel of analysts and journalists, following strict Editorial Guidelines based on E-E-A-T (Experience, Expertise, Authoritativeness, Trustworthiness). Every article is fact-checked against reputable sources to ensure accuracy, transparency, and reliability. Our review policy guarantees unbiased evaluations when recommending exchanges, platforms, or tools. We strive to provide timely updates about everything crypto & blockchain, right from startups to industry majors.
Investment Disclaimer:
All opinions and insights shared represent the author’s own views on current market conditions. Please do your own research before making investment decisions. Neither the writer nor the publication assumes responsibility for your financial choices.
Sponsored and Advertisements:
Sponsored content and affiliate links may appear on our site. Advertisements are marked clearly, and our editorial content remains entirely independent from our ad partners.
Read the Next News






Kommentar hinterlassen