


Bitcoin is approaching an important liquidity zone as leveraged traders continue to shape short-term price action. Recent liquidation heatmap data shows sizable clusters on both sides of the market, leaving traders watching whether BTC moves higher to trigger short liquidations or slips lower into leveraged long positions.
The immediate upside area is around $64,600, where a concentration of liquidity could attract Bitcoin if momentum continues. A move into the $65,500-$66,000 region could then expose a larger pool of short positions.
But the liquidation heatmap does not predict which direction Bitcoin will take. Instead, it shows price areas where forced position closures could amplify an existing move.
$64,600 Becomes a Liquidity Zone
A move towards $64,600 could force traders holding short positions to close them by buying Bitcoin back. That process can add further upward pressure and potentially push BTC towards the $65,500-$66,000 range.
However, reaching a liquidation cluster does not necessarily mean a breakout will follow. If Bitcoin attracts insufficient spot demand after taking liquidity, the market could reverse and return to its existing range.

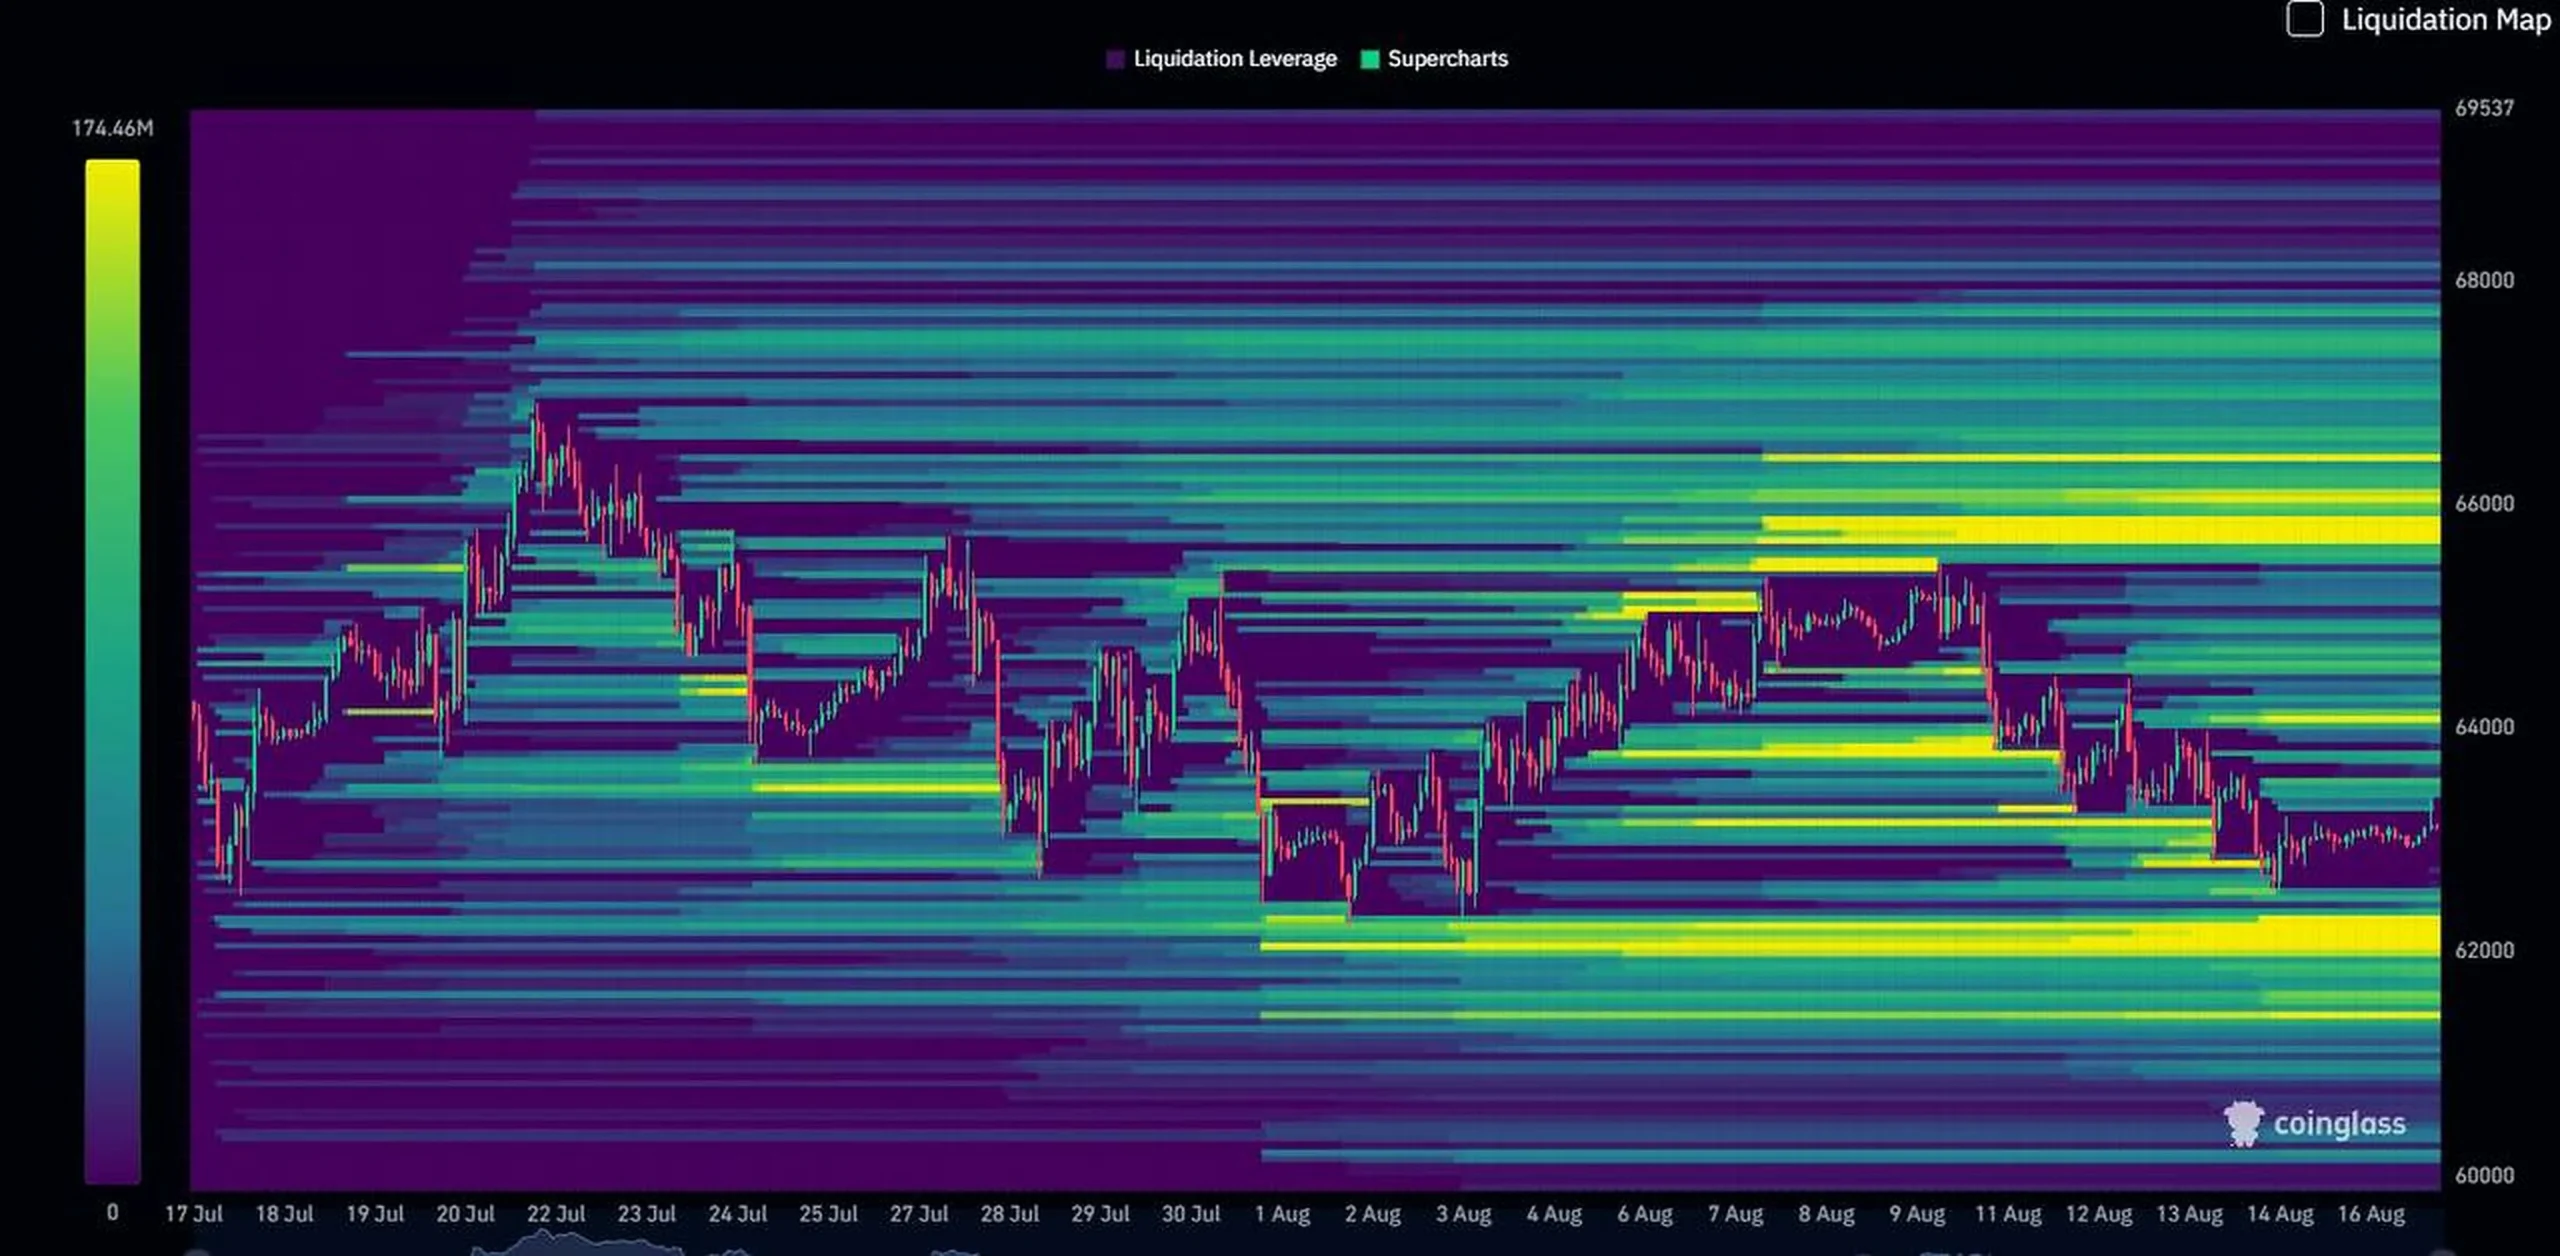
Data points to another liquidation concentration around $62,000-$62,500. A sustained move below $62,500 could activate this zone and accelerate selling as leveraged long positions are forced out.
Futures Leverage Remains a Risk
Bitcoin’s derivatives market remains central to the current setup. Spot trading participation has increased, but the available analysis shows that spot volume remains relatively low compared with futures activity.
Spot volume is estimated at about 5.96% of futures volume, below its 30-day average of roughly 6.2% and the 7% level viewed as more supportive of a stronger move.
That leaves the market vulnerable to sharp reversals if price movement continues to rely heavily on leveraged positions rather than fresh spot buying.
Bitcoin Faces a Liquidity Test
Bitcoin’s next move could therefore develop around three scenarios.
A sustained break above $64,600 could open the way towards $65,500-$66,000, particularly if short liquidations accelerate the move. Failure in that zone could instead leave BTC ranging between roughly $63,200 and $66,200.
On the downside, losing $63,700, followed by $63,200, could expose the lower liquidation cluster around $62,000-$62,500.
Was this writing helpful?
Story Ends Here
Trust with CoinPedia:
CoinPedia has been delivering accurate and timely cryptocurrency and blockchain updates since 2017. All content is created by our expert panel of analysts and journalists, following strict Editorial Guidelines based on E-E-A-T (Experience, Expertise, Authoritativeness, Trustworthiness). Every article is fact-checked against reputable sources to ensure accuracy, transparency, and reliability. Our review policy guarantees unbiased evaluations when recommending exchanges, platforms, or tools. We strive to provide timely updates about everything crypto & blockchain, right from startups to industry majors.
Investment Disclaimer:
All opinions and insights shared represent the author’s own views on current market conditions. Please do your own research before making investment decisions. Neither the writer nor the publication assumes responsibility for your financial choices.
Sponsored and Advertisements:
Sponsored content and affiliate links may appear on our site. Advertisements are marked clearly, and our editorial content remains entirely independent from our ad partners.
Read the Next News





Kommentar hinterlassen