


The Sandbox price has gained significant attention in the past few weeks, with a surge of over 170% that attracted some correction. After experiencing months of downward pressure, the crypto is showing signs of recovery, bringing it back into focus. On the other hand, the derivative activity is also on the rise, but the concern arises with the cumulative volume delta, which suggests the buying pressure remains uncertain.
Now that the SAND price is trading around $0.062, all eyes are on the local resistance zone close to $0.07; breaking it would see the metaverse token rise above the bearish influence. Now the question arises: will the rally see further upside, or will renewed selling pressure derail the recovery?
SAND Price Faces Resistance at $0.069
The SAND price recovered from its September lows around $0.035, followed by a sharp October rally to $0.08 and a subsequent pullback. Currently, the price trades around $0.063, with the immediate hurdle at $0.069. The latest rebound seems to have attracted the bulls, as the trading volume has been on the rise, with the 24-hour volume increasing by nearly 560%, reaching $225 million. Therefore, an extended upswing beyond the immediate resistance at $0.07 could open the way toward $0.08 and higher levels.

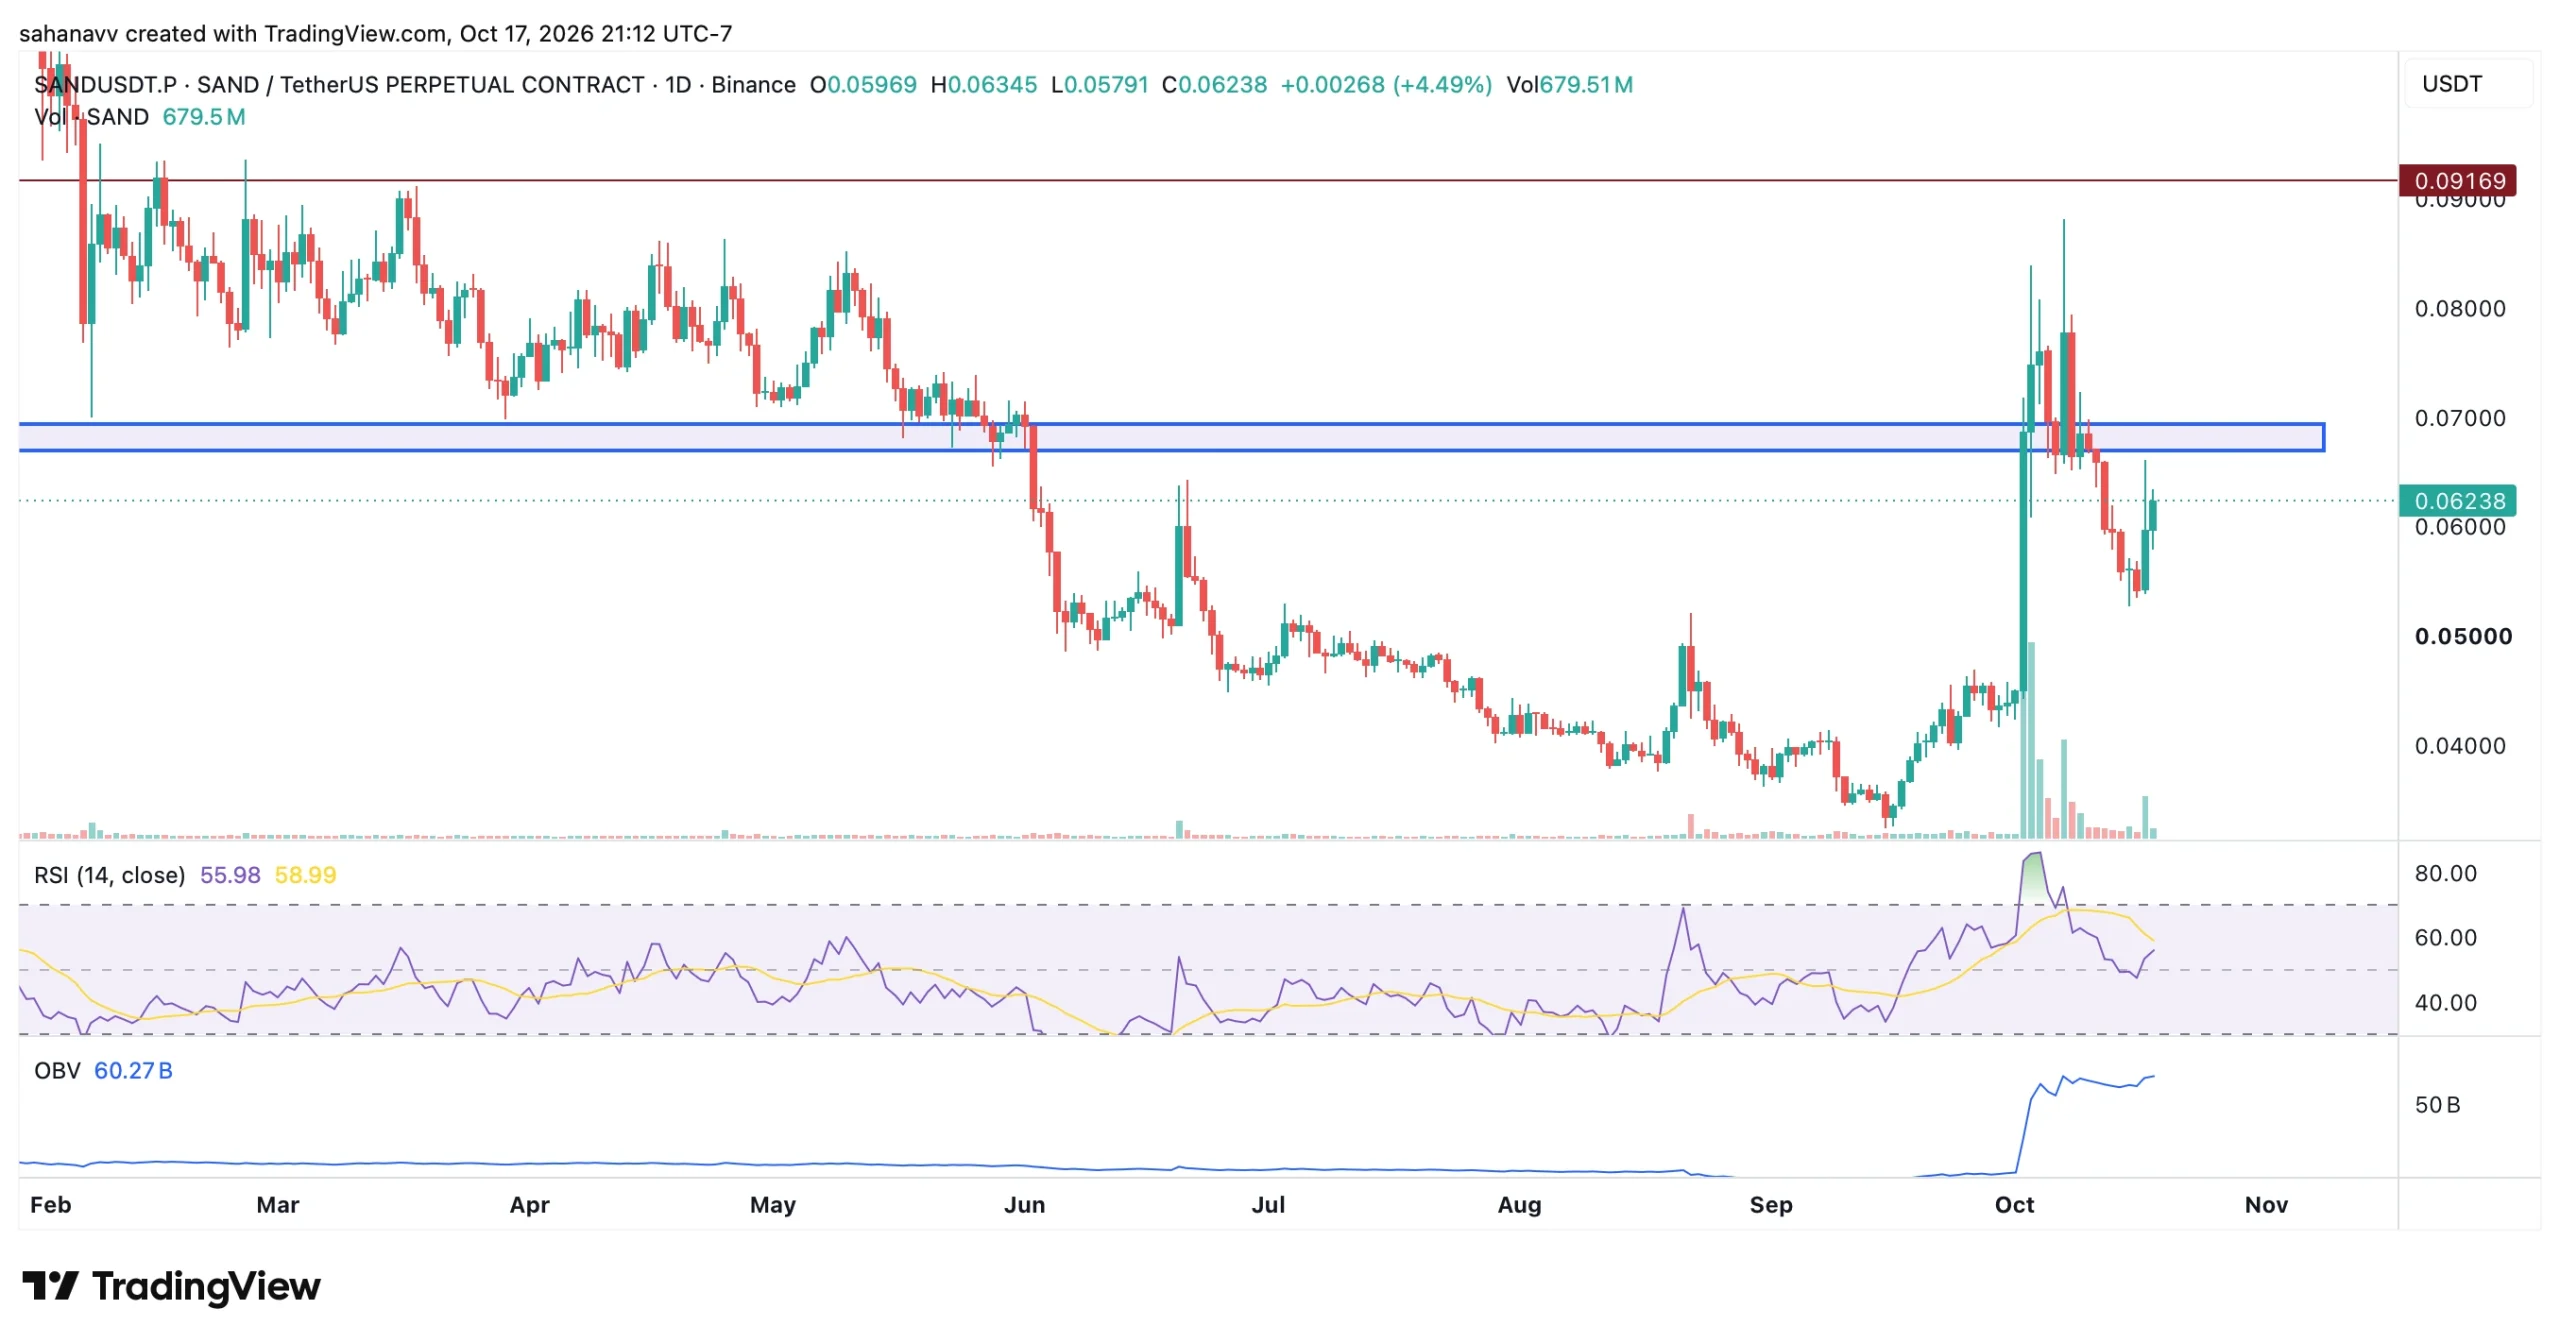
The RSI has rebounded from average levels, signalling that bullish momentum has recovered but remains unconfirmed. Meanwhile, on-balance volume jumped sharply, reflecting increased trading activity without confirming sustained spot buying. For now, SAND’s price action points to a potential recovery rather than a confirmed trend reversal. Reclaiming $0.069 would strengthen the bullish case, while failure to hold support could put the October rally at risk.

Rising Open Interest & Negative Funding Rate Hints at Volatility
SAND’s derivatives data shows a sharp increase in market participation following the October rally; underlying buying pressure remains uncertain. Rising open interest and negative funding rates leave room for a potential short squeeze, while declining CVD points towards continued selling pressure.

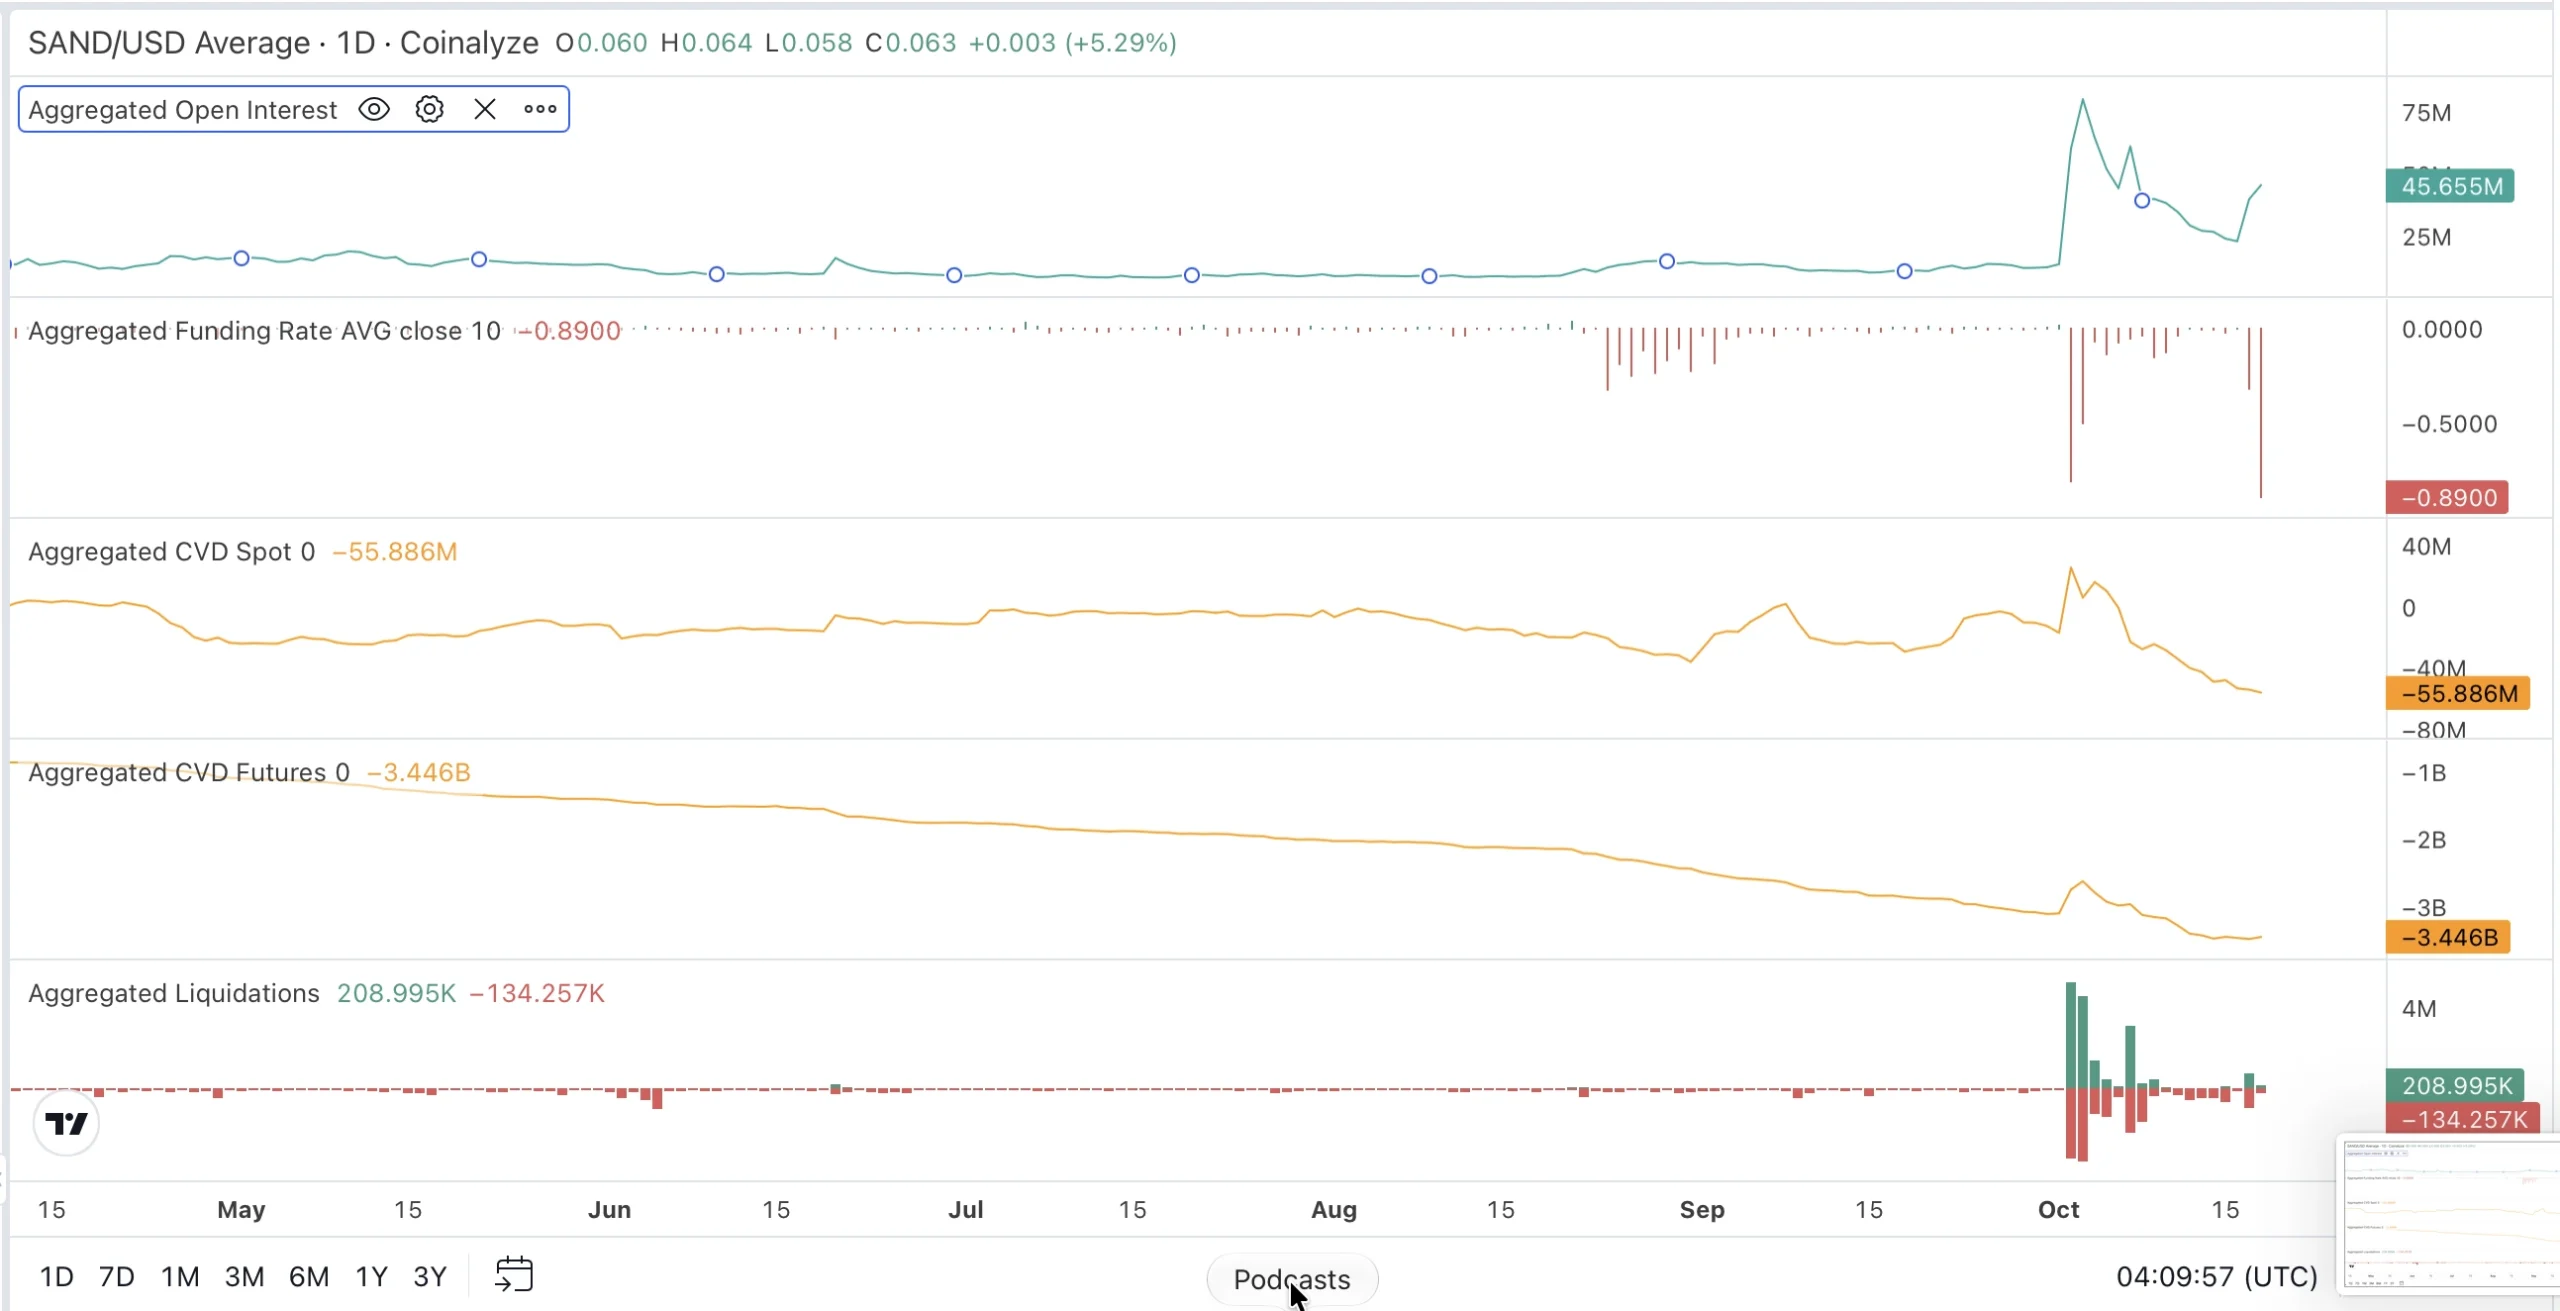
- Open Interest: The OI has experienced a significant rebound from the local lows around 23.40M to 45.65M, indicating a rise in derivative activity
- Funding Rate: The funding rate has turned extremely negative to -0.8900, indicating that short traders are paying long traders, suggesting bearish positioning
- Spot CVD: The spot CVD has declined to -55.66M after a brief spike during October’s volatility, suggesting aggressive selling has outweighed aggressive buying. This raises questions about whether the spot demand can sustain the recovery
- Futures CVD: Futures CVD has also dropped to -3.44 billion, indicating persistent net aggressive selling in derivative markets, weakening the bullish case.
- Liquidations: The chart shows subsequent liquidation activity during October’s price spike and subsequent pullback
The combination of a negative funding rate and elevated open interest creates the potential for another short squeeze. However, declining spot and futures CVD suggests that buying pressure remains unconfirmed. A sustained recovery in spot CVD alongside a breakout above the $0.067 to $0.069 resistance zone would strengthen the bullish outlook; otherwise, the rally remains vulnerable to renewed selling.
Key Levels to Monitor
The next move could depend on whether buyers can defend immediate support and reclaim the resistance zone. With the token trading near $0.062, the following levels could determine whether the October recovery extends or reverses.
- Immediate Resistance: $0.064 to $0.065
- Major Resistance: $0.067 to $0.069
- Higher Resistance: $0.077 to $0.080
- Key Support: $0.060 to $0.061
- Lower Support: $0.057 to $0.058
Bullish Scenario: If the SAND price reclaims $0.067 to $0.069 with stronger trading volume and improving spot CVD, the rally could extend toward $0.077 to $0.080 and potentially $0.09169. A sustained move toward $0.10 would require further upside follow-through.
Bearish Scenario: If the SAND price fails to break resistance and falls below $0.060, selling pressure could push the token toward $0.057 to $0.058. Continued weakness could expose the $0.053 to $0.055 region.
The Bottom Line: Can the Sandbox (SAND) Price Reach $0.1 in 2026?
SAND’s rally potential in 2026 will depend on whether broader market sentiment, demand for metaverse tokens, and activity across The Sandbox ecosystem improve. A move to $0.10 remains possible, but it will likely require a sustained recovery in the crypto market and renewed investor interest in the project.
The key catalyst to watch is whether the Sandbox price can attract enough fresh demand to sustain its recovery rather than relying on short-term speculative activity. Without stronger participation, the token could struggle to maintain its recent gains.
Overall, the SAND price has room to rally further in 2026, but $0.10 should be treated as an upside scenario, not a guaranteed destination. Sustained demand and improving market conditions will be essential for the token to approach that level.
Was this writing helpful?
Story Ends Here
Trust with CoinPedia:
CoinPedia has been delivering accurate and timely cryptocurrency and blockchain updates since 2017. All content is created by our expert panel of analysts and journalists, following strict Editorial Guidelines based on E-E-A-T (Experience, Expertise, Authoritativeness, Trustworthiness). Every article is fact-checked against reputable sources to ensure accuracy, transparency, and reliability. Our review policy guarantees unbiased evaluations when recommending exchanges, platforms, or tools. We strive to provide timely updates about everything crypto & blockchain, right from startups to industry majors.
Investment Disclaimer:
All opinions and insights shared represent the author’s own views on current market conditions. Please do your own research before making investment decisions. Neither the writer nor the publication assumes responsibility for your financial choices.
Sponsored and Advertisements:
Sponsored content and affiliate links may appear on our site. Advertisements are marked clearly, and our editorial content remains entirely independent from our ad partners.
Read the Next News






Kommentar hinterlassen